Chart View
The Chart View visually represents sensor data, allowing users to monitor trends, analyze changes, and identify anomalies over time. Each line on the chart corresponds to a sensor measurement or a calculated metric. The chart updates in real-time, ensuring you always have the latest data.
Navigating in the Chart
- Zooming: Use the + and - buttons on the chart to zoom in or out
- Panning: Click and drag the chart left or right to move through the timeline without changing the selected timeframe
- Hovering for Details: Hover your cursor over a line on the chart to see precise data values and timestamps at specific points
- Lock and Unlock Function: Use the Lock feature to fix the chart view in place, preventing accidental zooming or panning while analyzing data. Unlock the chart to resume free movement and adjust the view as needed
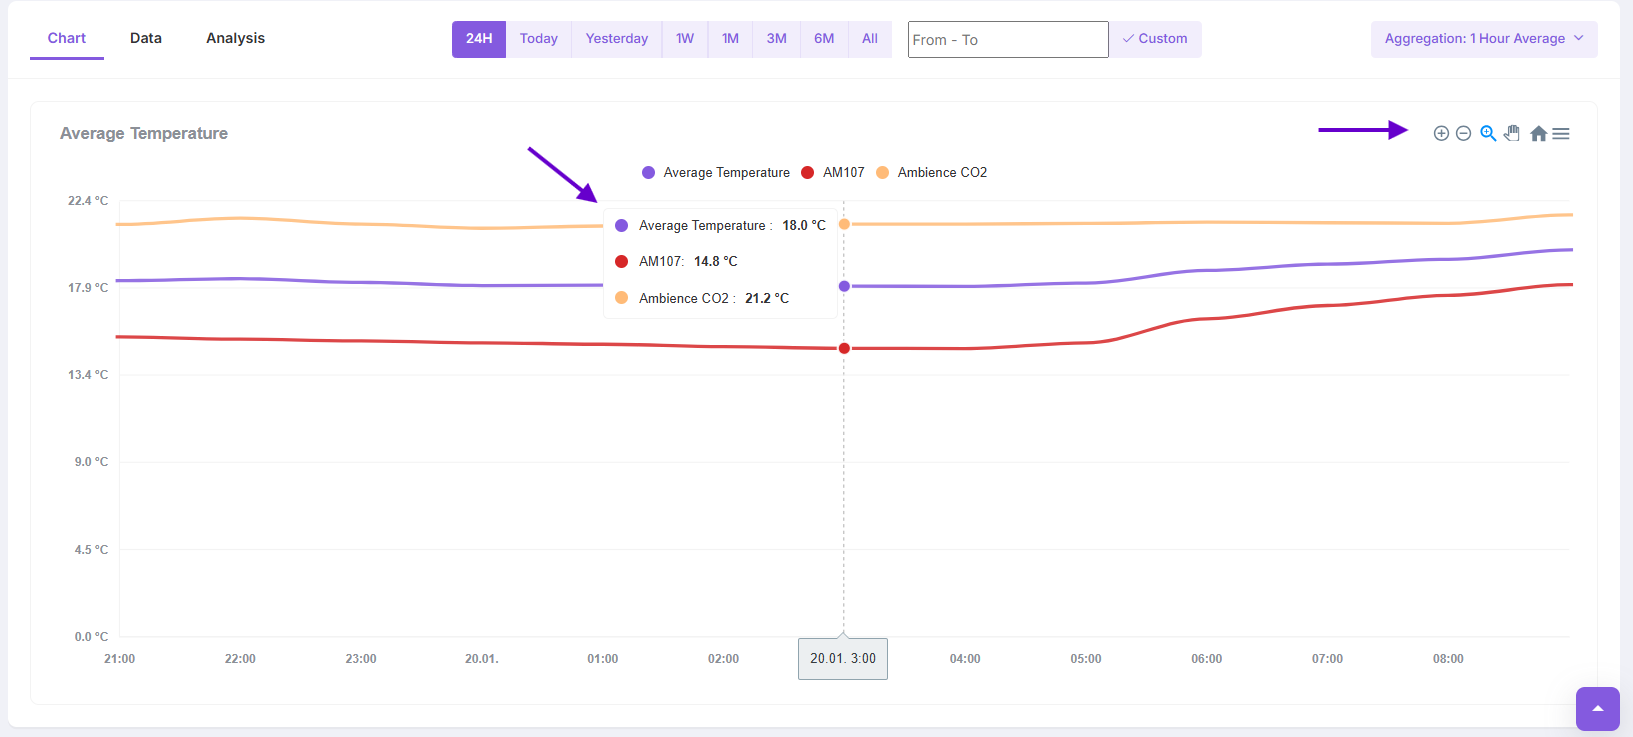
Chart Settings
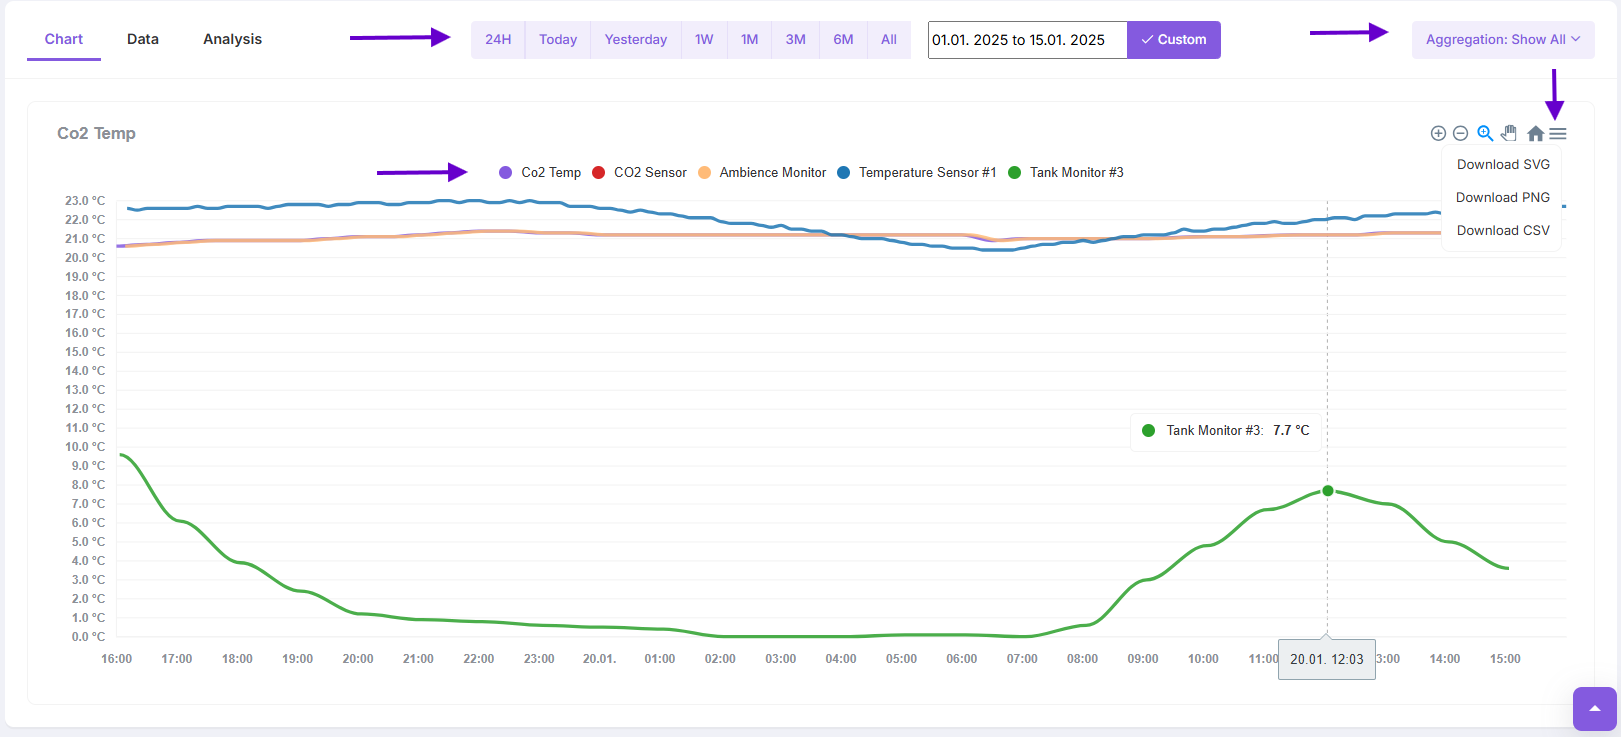
Timeframe:
- Choose from predefined time ranges such as 24H, Today, 1W, 1M, 3M, 6M, All or use the Custom option to manually set start and end dates, focusing on specific time periods for analysis
- Adjusting the timeframe refines the chart view to better suit your monitoring needs
Aggregation
- Use aggregation settings like 1-Hour Average to group data points into summarized intervals
- Aggregation smooths out fluctuations, making trends easier to spot in large datasets
- Selecting different aggregation levels dynamically updates the chart to provide varying levels of detail
Download Data
- Click the download icon to export the chart data in a preferred format (e.g., CSV or Excel)
- This feature enables offline analysis, data sharing, or record-keeping for further processing or reporting
Customizing the Chart View
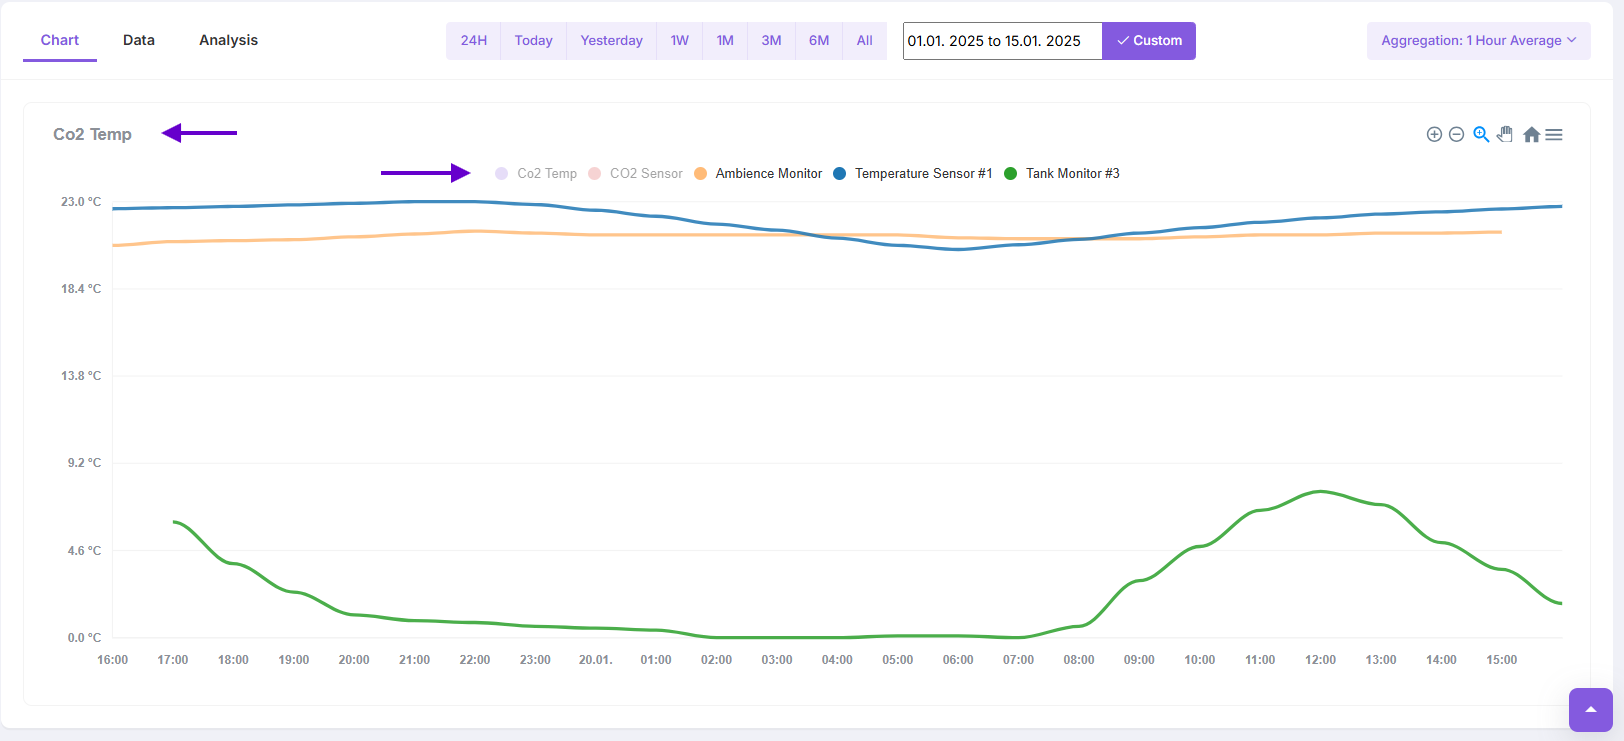
Legend
- Use the legend at the top of the chart to identify which lines represent each measurement or calculation for easy interpretation
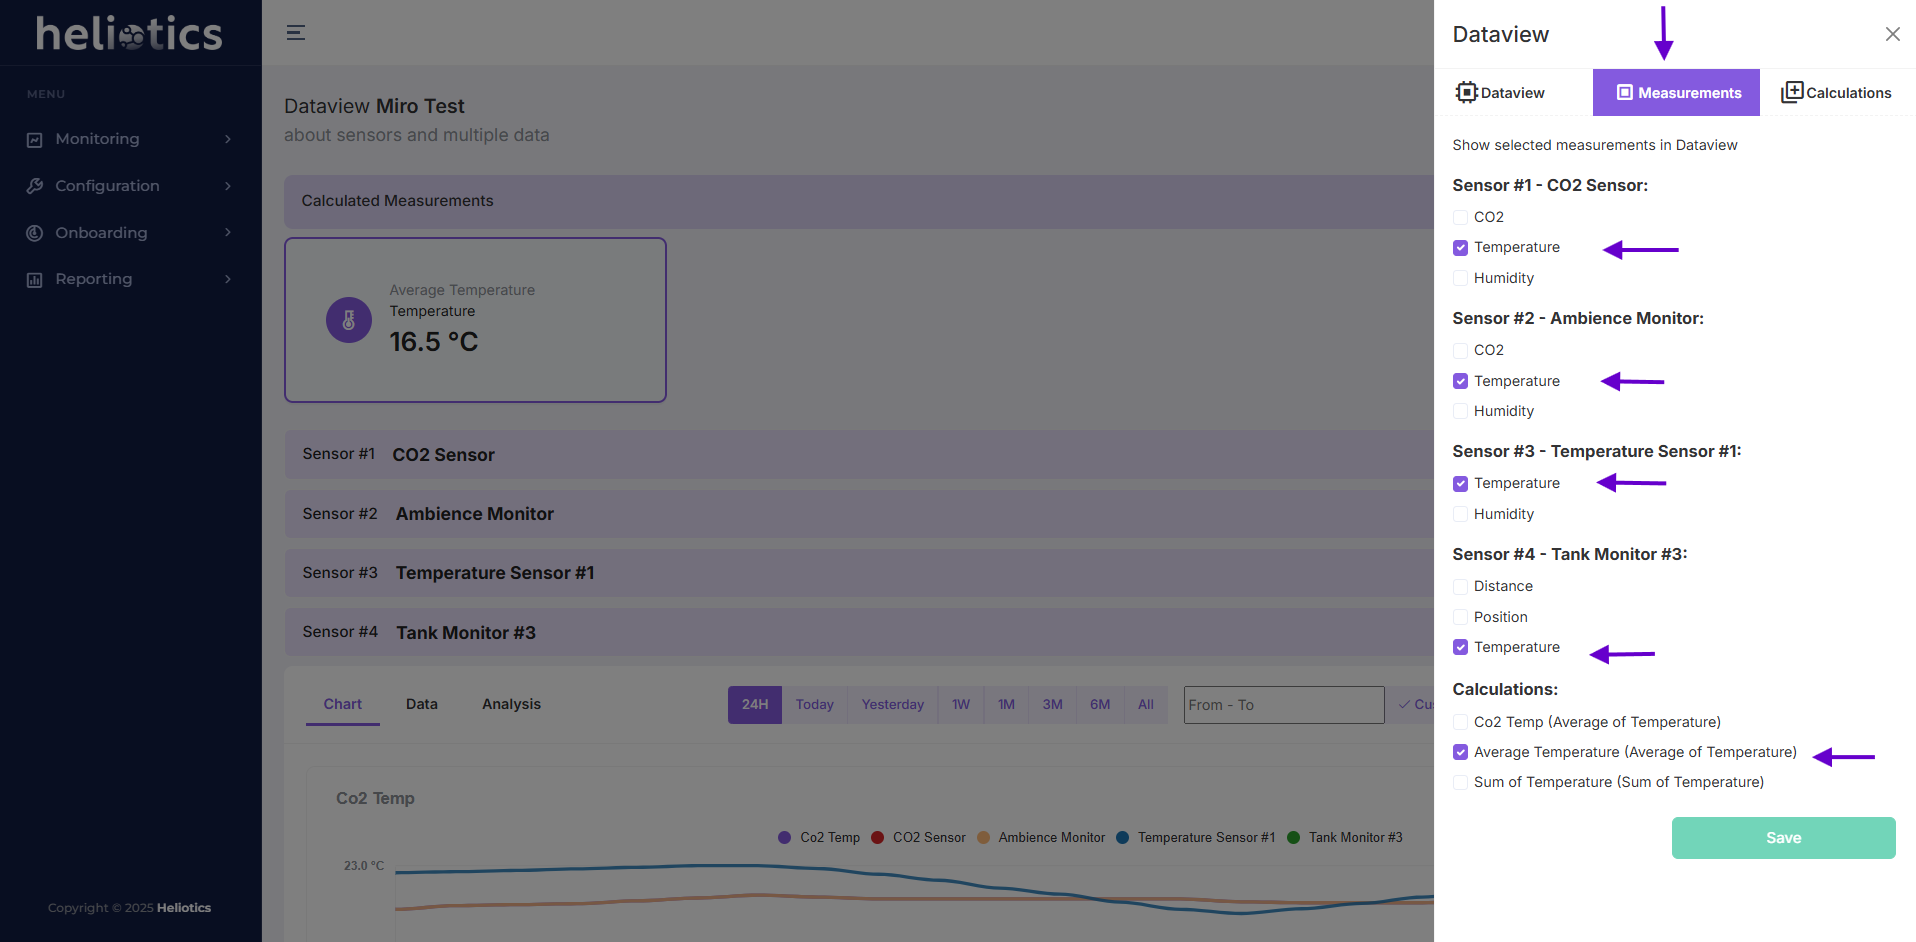
Add or Remove Data
- To add or Remove Data from Chart navigate to Dataview Settings
- Select specific sensor or calculated metrics (average, sum) to display on the Chart
- This customization ensures the chart focuses only on the most relevant data