Dataview Overview
In addition to graphical data, Dataviews display sensor-reported information directly in the interface
This includes:
-
Current Values: Real-time readings from selected sensors (e.g., temperature: 22°C, humidity: 45%)
-
Status Indicators: Notifications about device health, battery status, or connectivity
-
Event Logs: Specific events logged by the sensor, such as disconnection or environmental changes

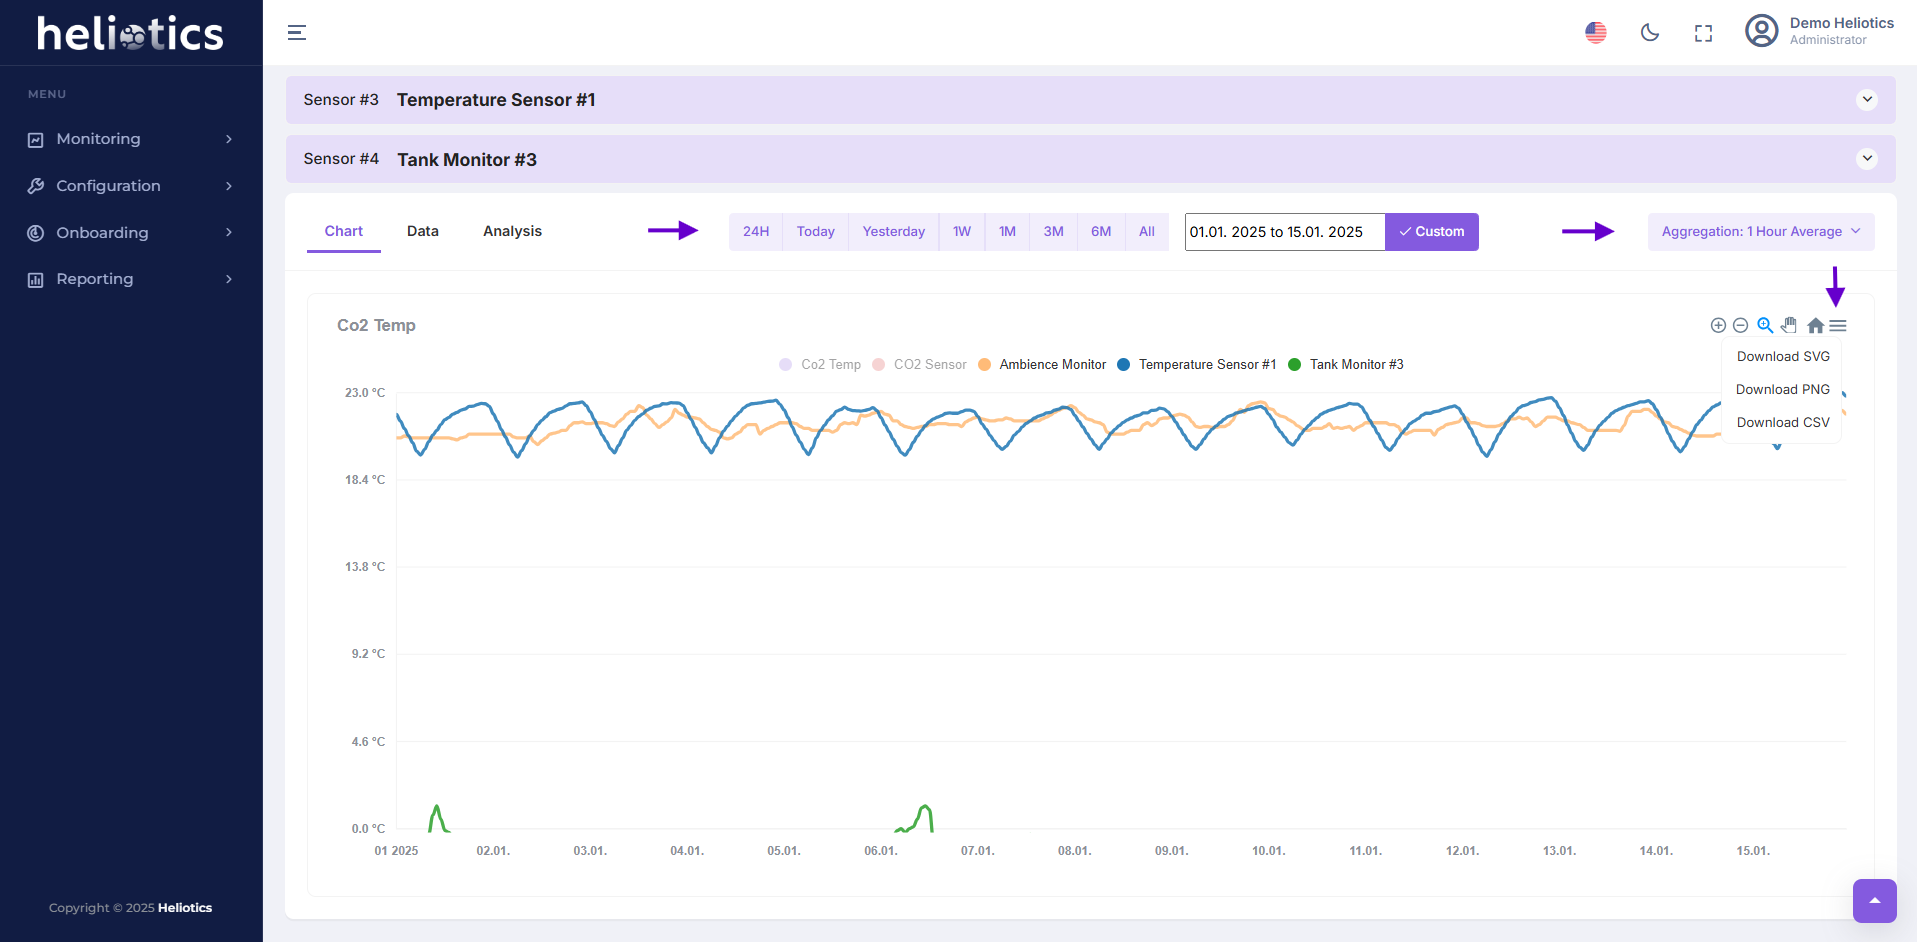
Chart
Dataviews are also presented as graphs for clear and concise data visualization
Chart Features:
-
Hover-over Insights: Hover over a data point to see precise values and timestamps
-
Dynamic Legends: Toggle data series on/off to focus on specific aspects
-
Zoom and Pan: Examine specific periods or zoom out for a broader overview

Chart Settings
Time Range Adjustments
- Modifying the time range dynamically updates the graph and the corresponding sensor-reported data
Aggregation Adjustments
- Select how data points are aggregated (e.g., hourly, daily, or weekly averages). This helps simplify complex datasets and focus on meaningful trends
- Switching from raw data to daily averages or preferred ones smooths out noise and highlights consistent patterns
Choosing Specific Sensor
- Toggle which sensors or parameters are displayed on the graph for more focused analysis
- For example if you want to monitor temperature or humidity, you can temporarily hide other parameters
Dataviews provide the option to download graph information, enabling further offline analysis or integration with other tools
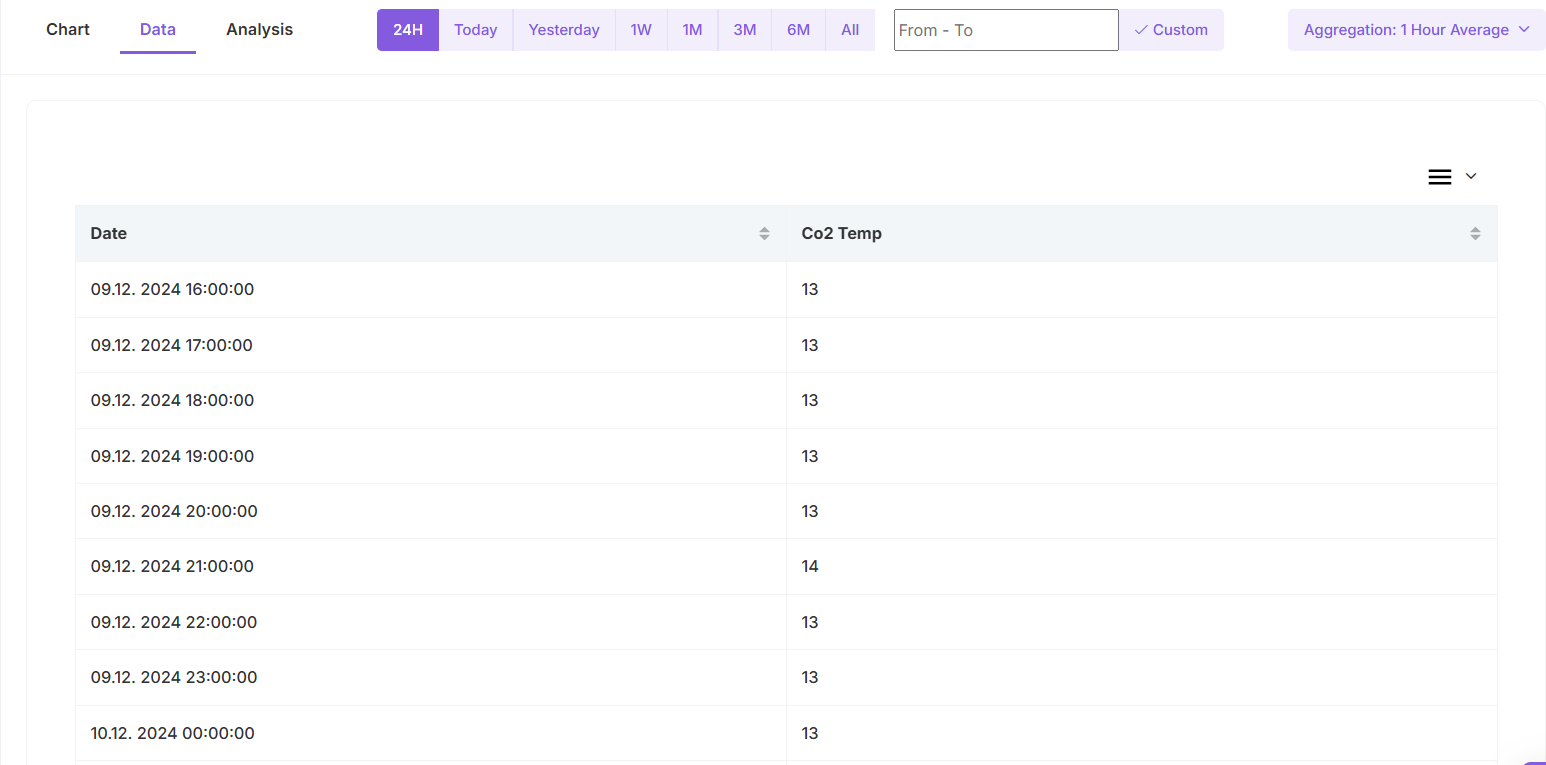
Data Section in Dataviews
- Data section provides raw information reported by the sensor
- Displays exact readings reported by sensors, such as temperature, humidity, energy consumption, or any other monitored parameters
- The reported data can be customized with adjustable time ranges and aggregation options
- The data section also allows you to download a spreadsheet of the reported data for further analysis
Analysis Section in Dataviews
- Analysis section provides summarized metrics and statistical insights into the sensor-reported data.
- This section helps users quickly interpret key data characteristic, identify trends and much more
Analysis shows:
- Records Count: Total number of data points recorded within the selected time range
- Minimum Value: Lowest reported value in the dataset, helping identify minimum thresholds
- Maximum Value: Highest reported value, offering insights into peaks in the monitored parameter
- Average Value: Provides the mean value of all data points, useful for identifying general trends or baseline conditions
- Standard Deviation: Indicates the variability or spread of the data, giving insights into fluctuations over time
The analysis of reported data can be customized with adjustable time ranges and aggregation settings
