Dashboard Chart View
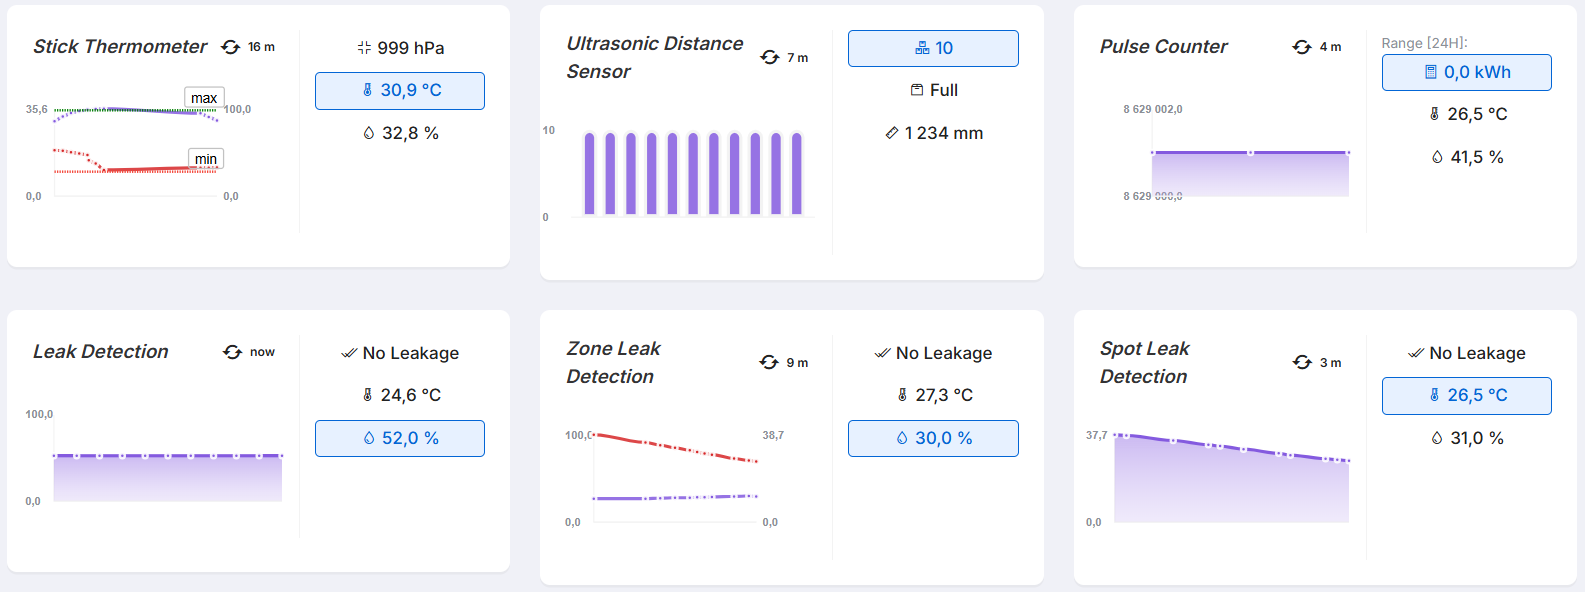
The dashboard allows you to view real-time charts without opening individual sensor details. Each chart shows the latest 20 reported values and highlights minimum and maximum levels for quick evaluation. This helps you monitor trends and react faster - all from one place.
How to Display Charts
Click the chart icon in the top bar
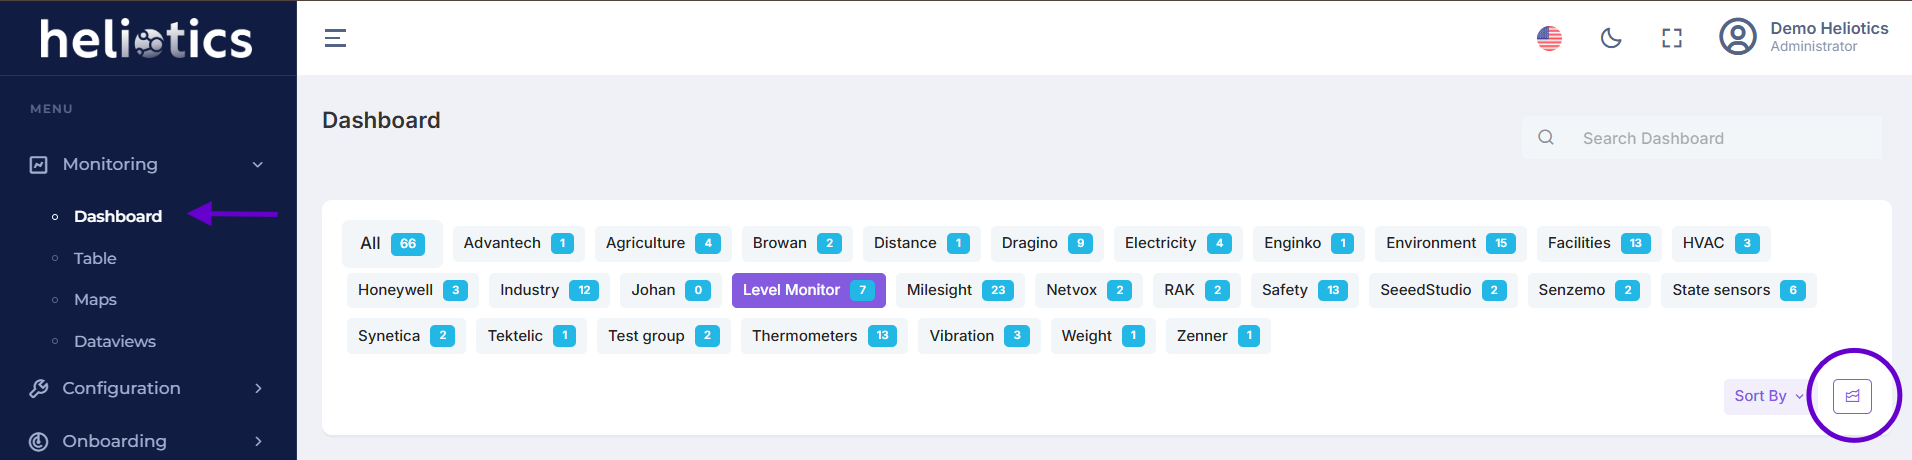
This opens real-time charts on all onboarded sensors across the dashboard
Or click a sensor’s data panel directly and select data stream you want to display
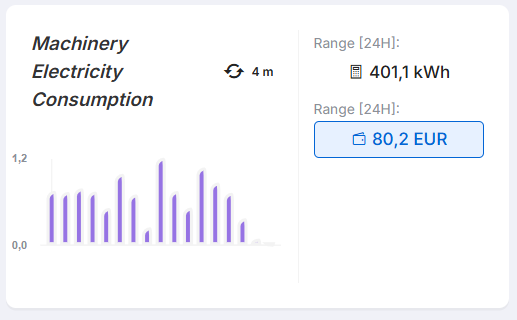
Charts refresh automatically with each new value and visualize min/max thresholds for quick interpretation